
In my 5th semester of college, I got an opportuniity to work on a data art project. The project mainly focused on making a 3D data art piece which was designed using NFHS 4 and NFHS 5 data from India in 2016 and 2019, respectively. It was focused on analyzing factors that contribute to stunted growth, with data from the top five states with the highest rates of stunted growth in NFHS-4. I incorporated six factors affecting stunted growth in the data art. I used abacus as my inspiration to potray my data visulization
Determinants impacting stunted growth patterns in India.
Timeline
July 2022, 4 weeks
My Team
Me
My Focus
Storytelling I Data collection I Collecting stories I Design Intervention
Project Type
Data Visualization
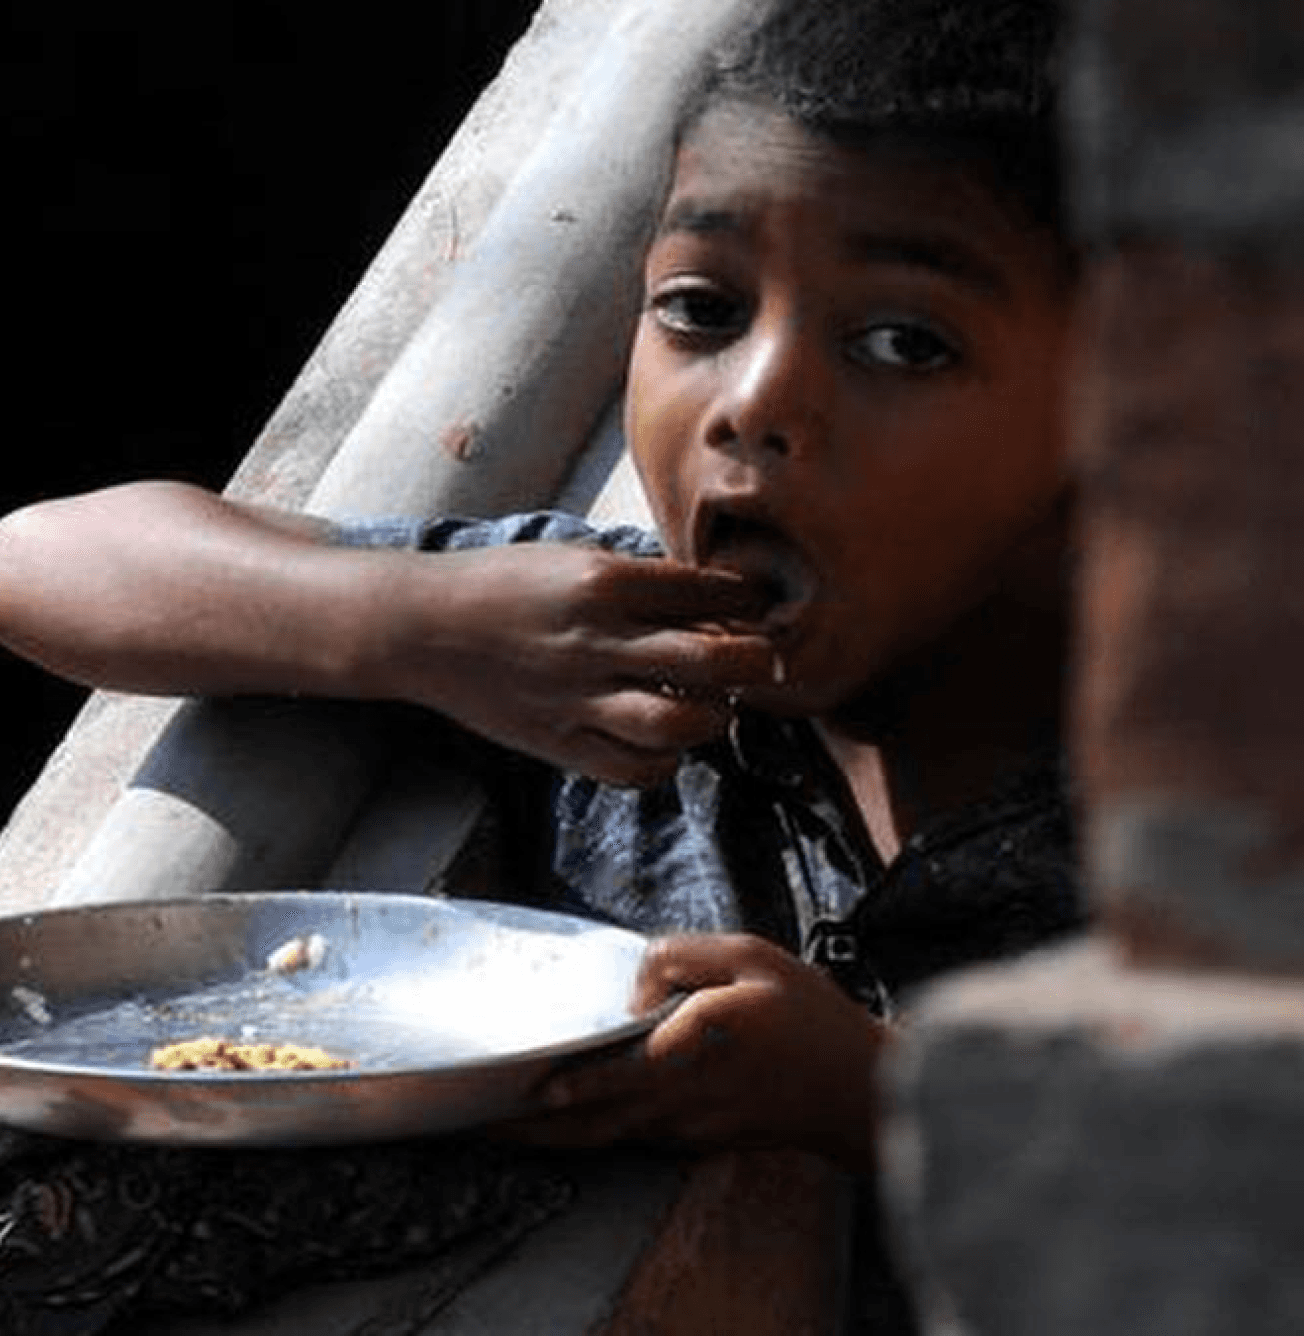
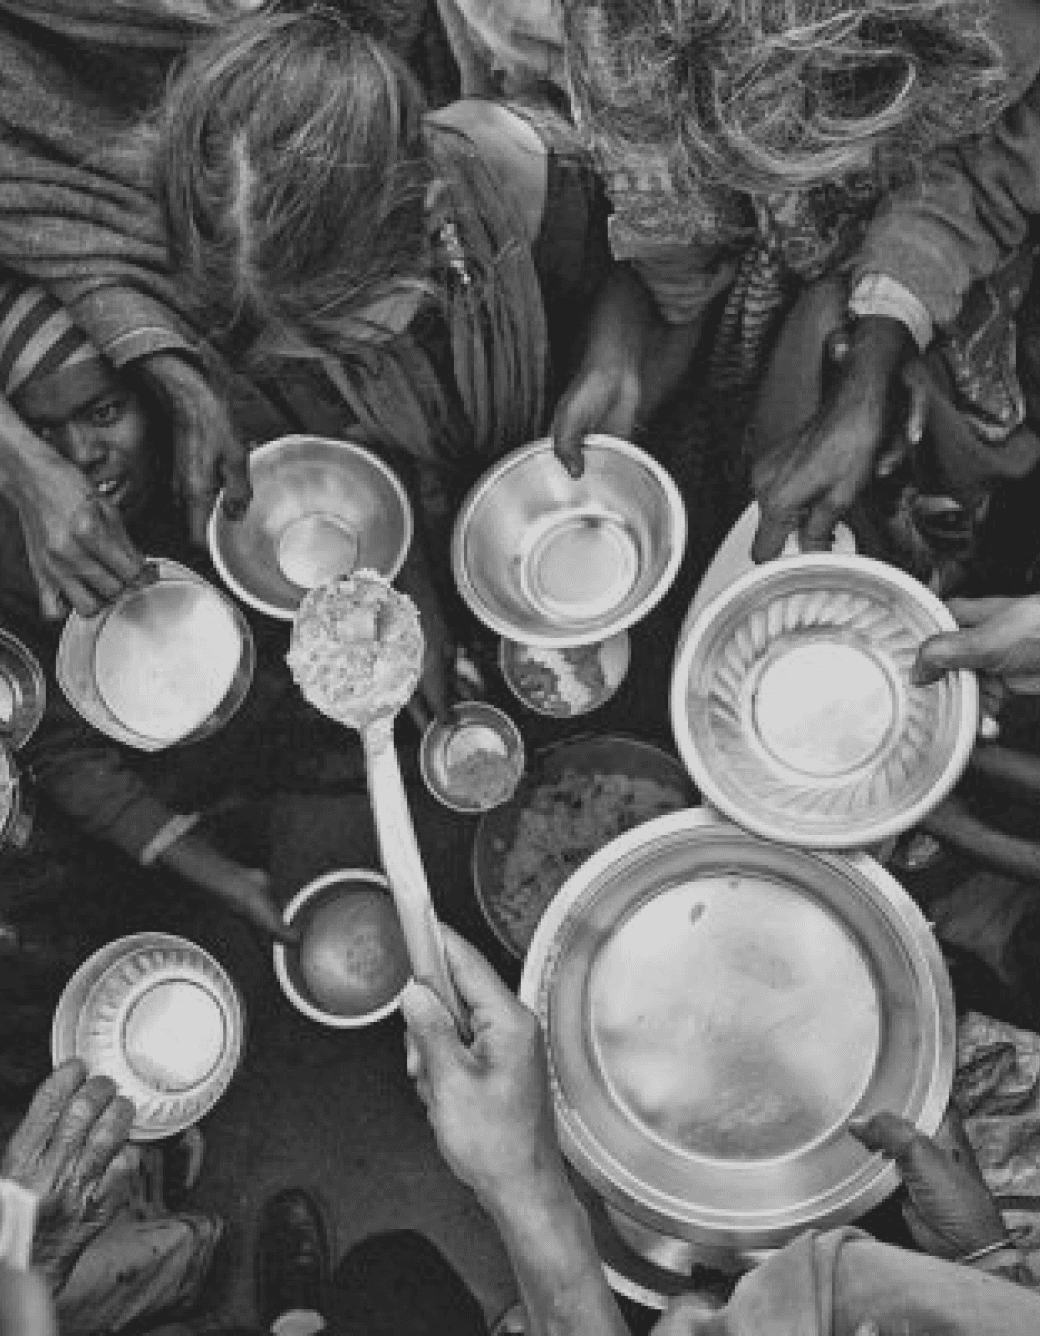
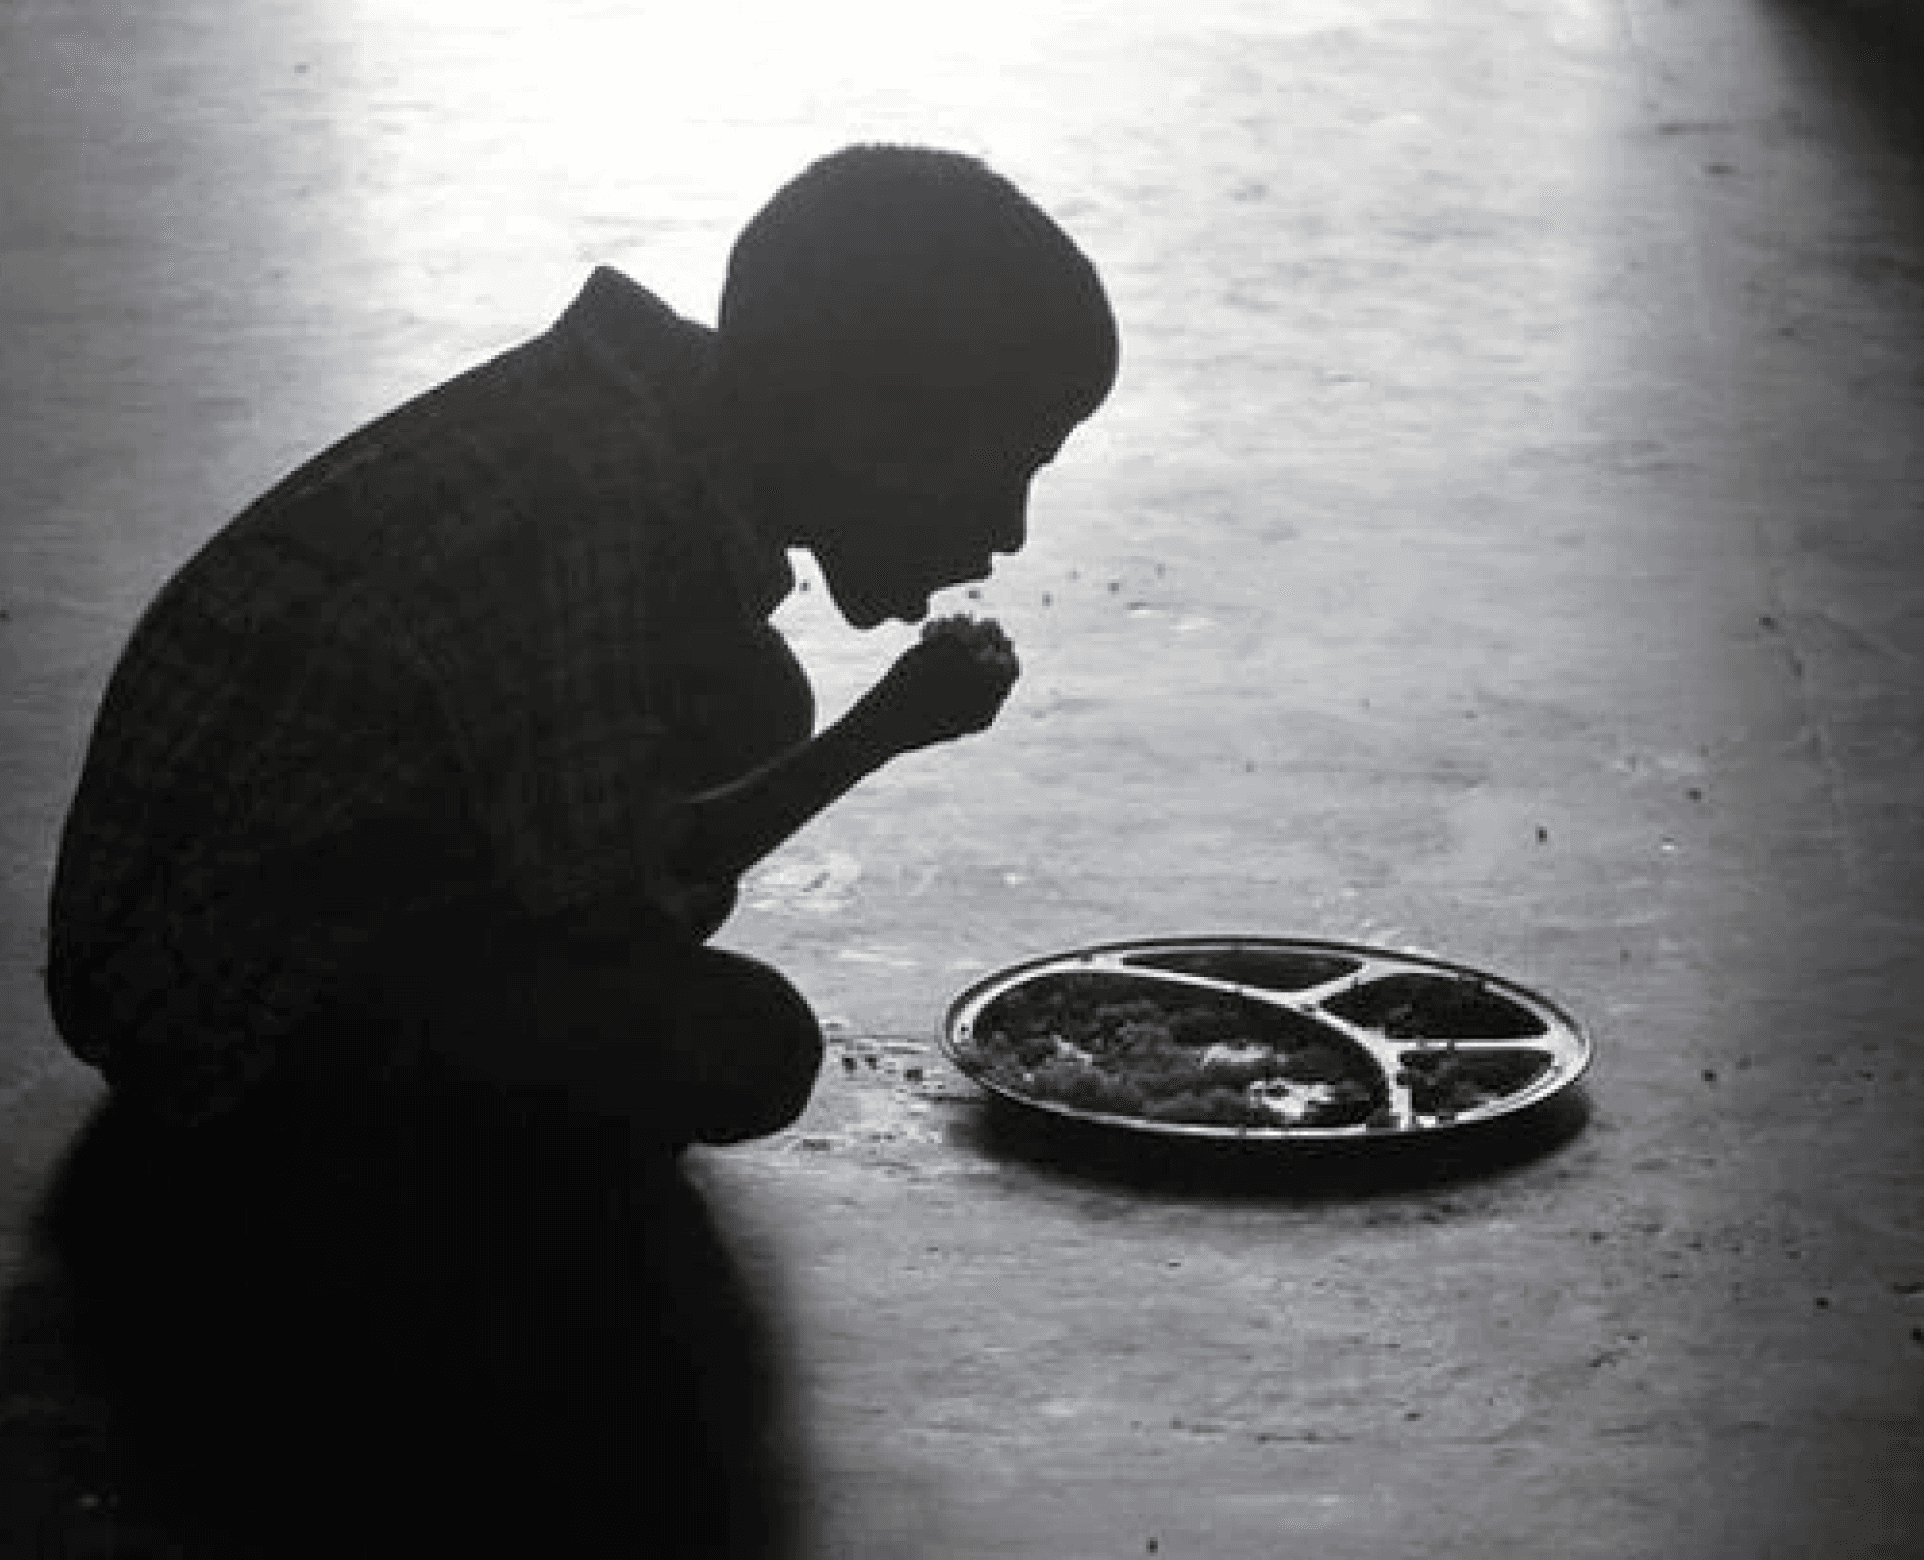
46 million children in India are ‘stunted’ because of malnutrition and 25 million more defined as ‘wasted’
What is stunted growth defined as?
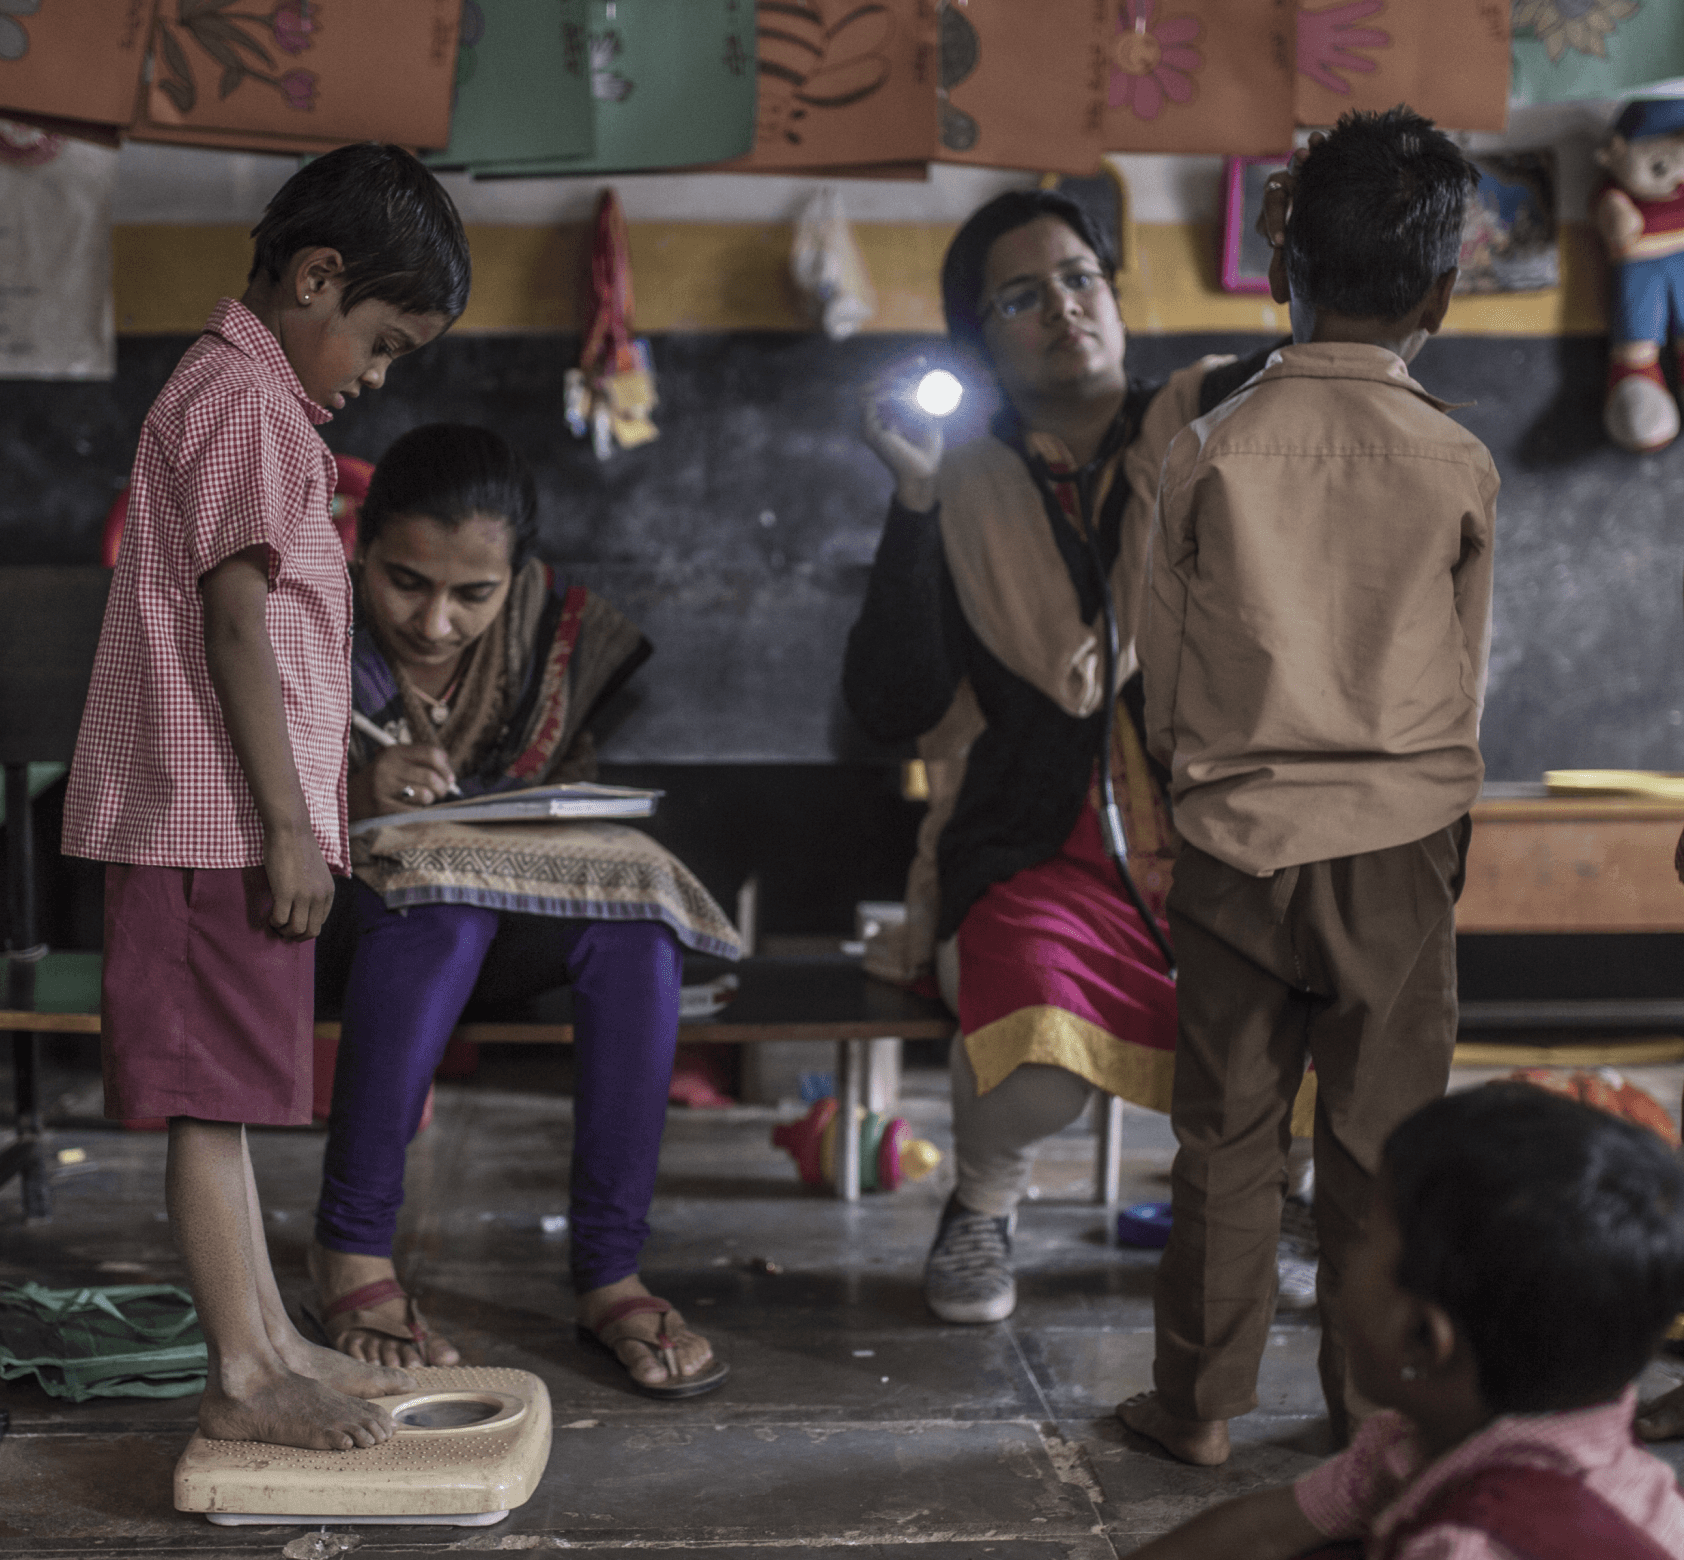
Stunted growth in children is a condition where a child's height is significantly lower than what is considered normal for their age and gender. It is usually the result of inadequate nutrition, especially during the first 1,000 days of a child's life, which includes pregnancy and the first two years after birth. Poor nutrition during this period can lead to irreversible damage to a child's physical and mental development.
135
140
145
150

NFHS 4 (2016)
48%
NFHS 5 (2019)
35.5%
According to National Family Health Survey the rate of stunted growth in INDIA is
Before we proceed, let's gain a clear understanding of the process at hand.
Explore
Conceptualize
Analyze
01
DATA EXPLORATION
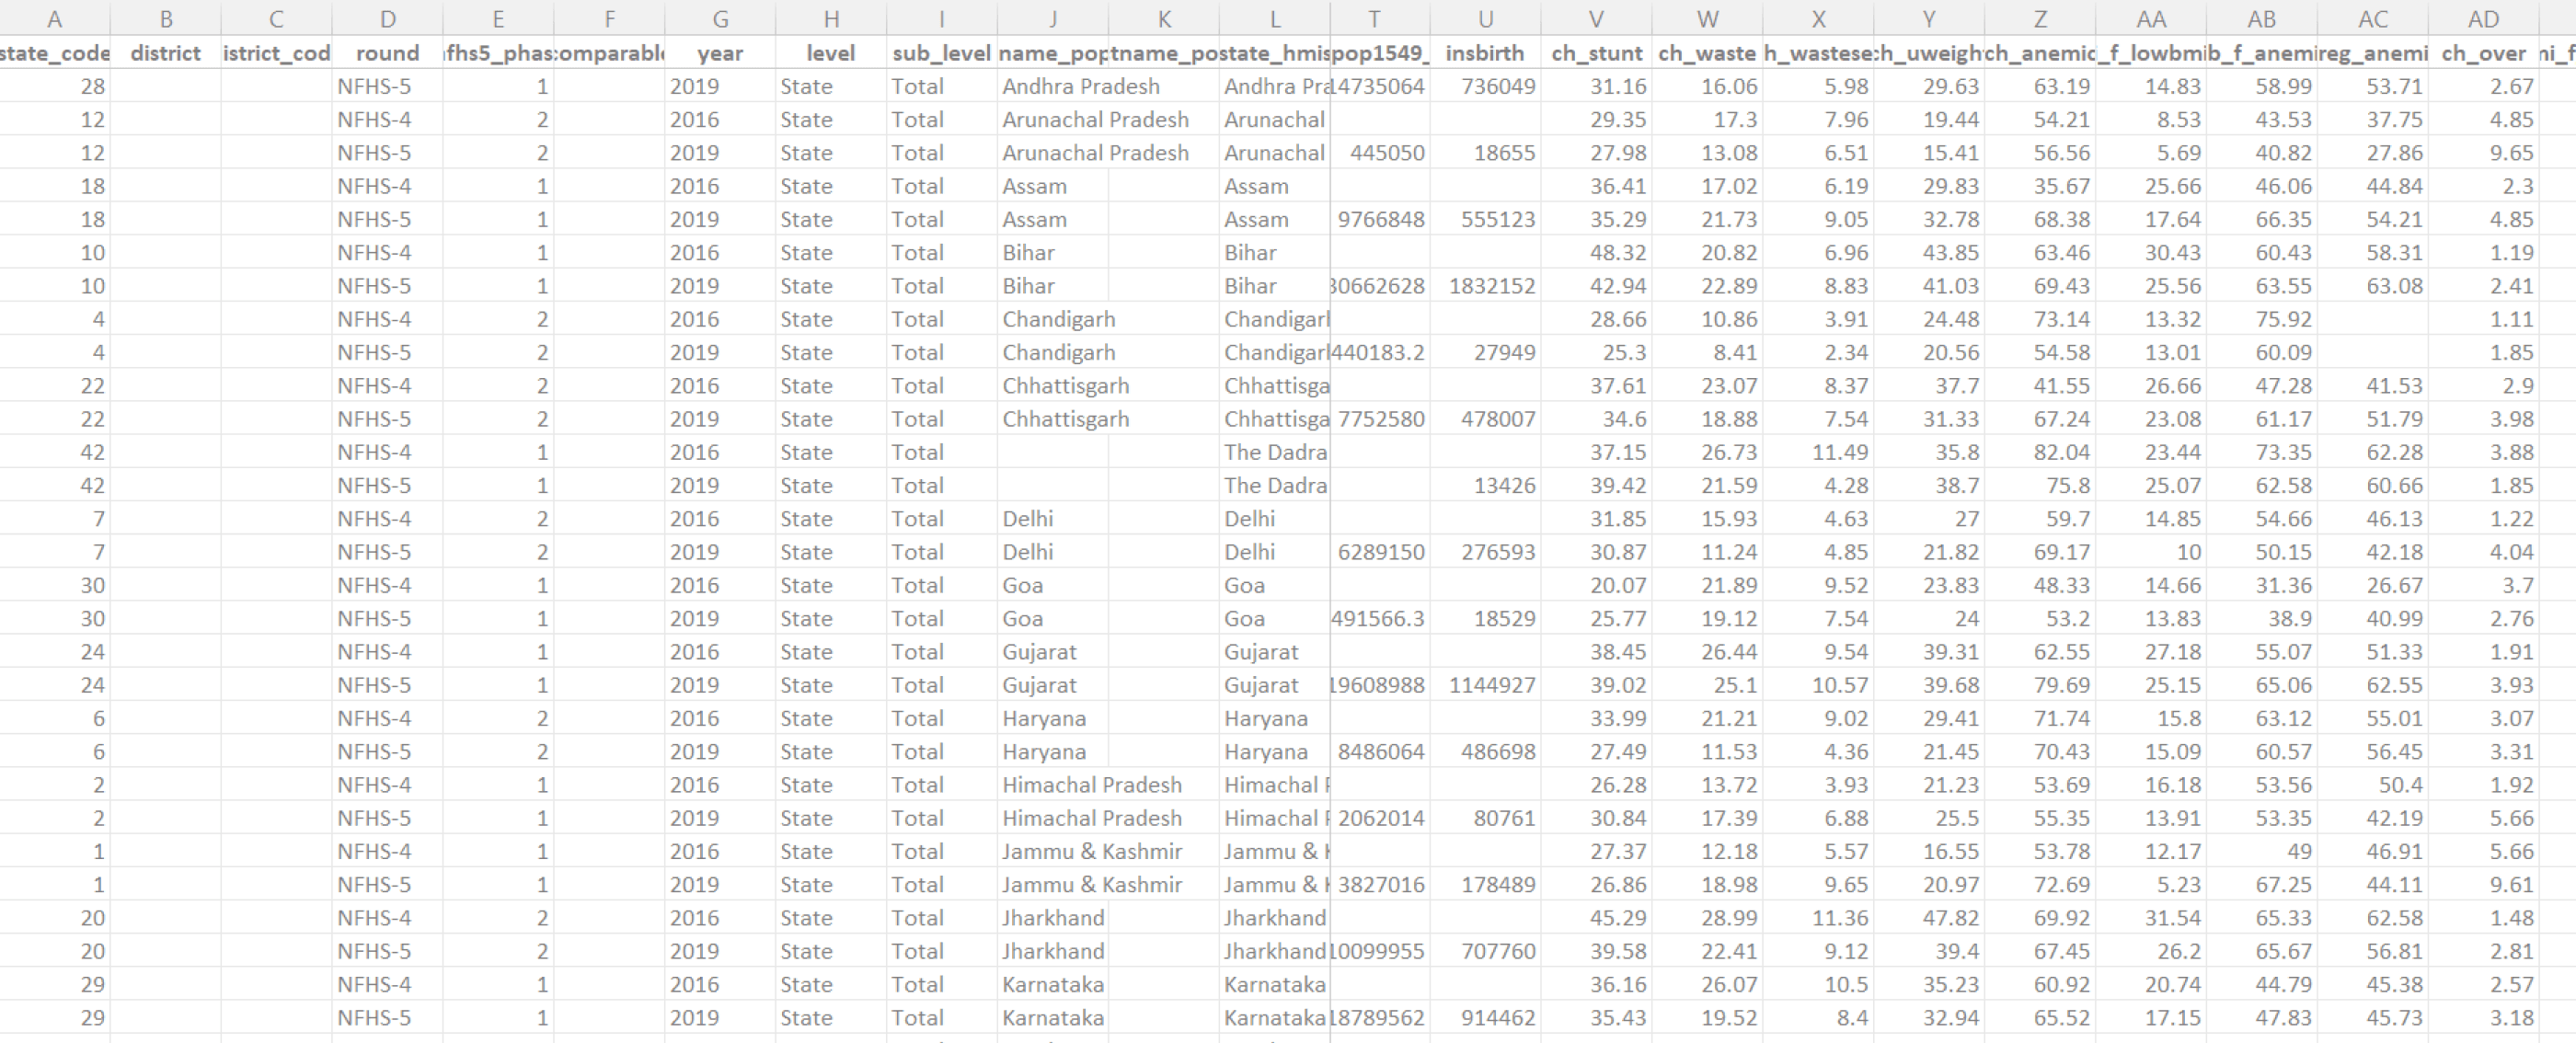
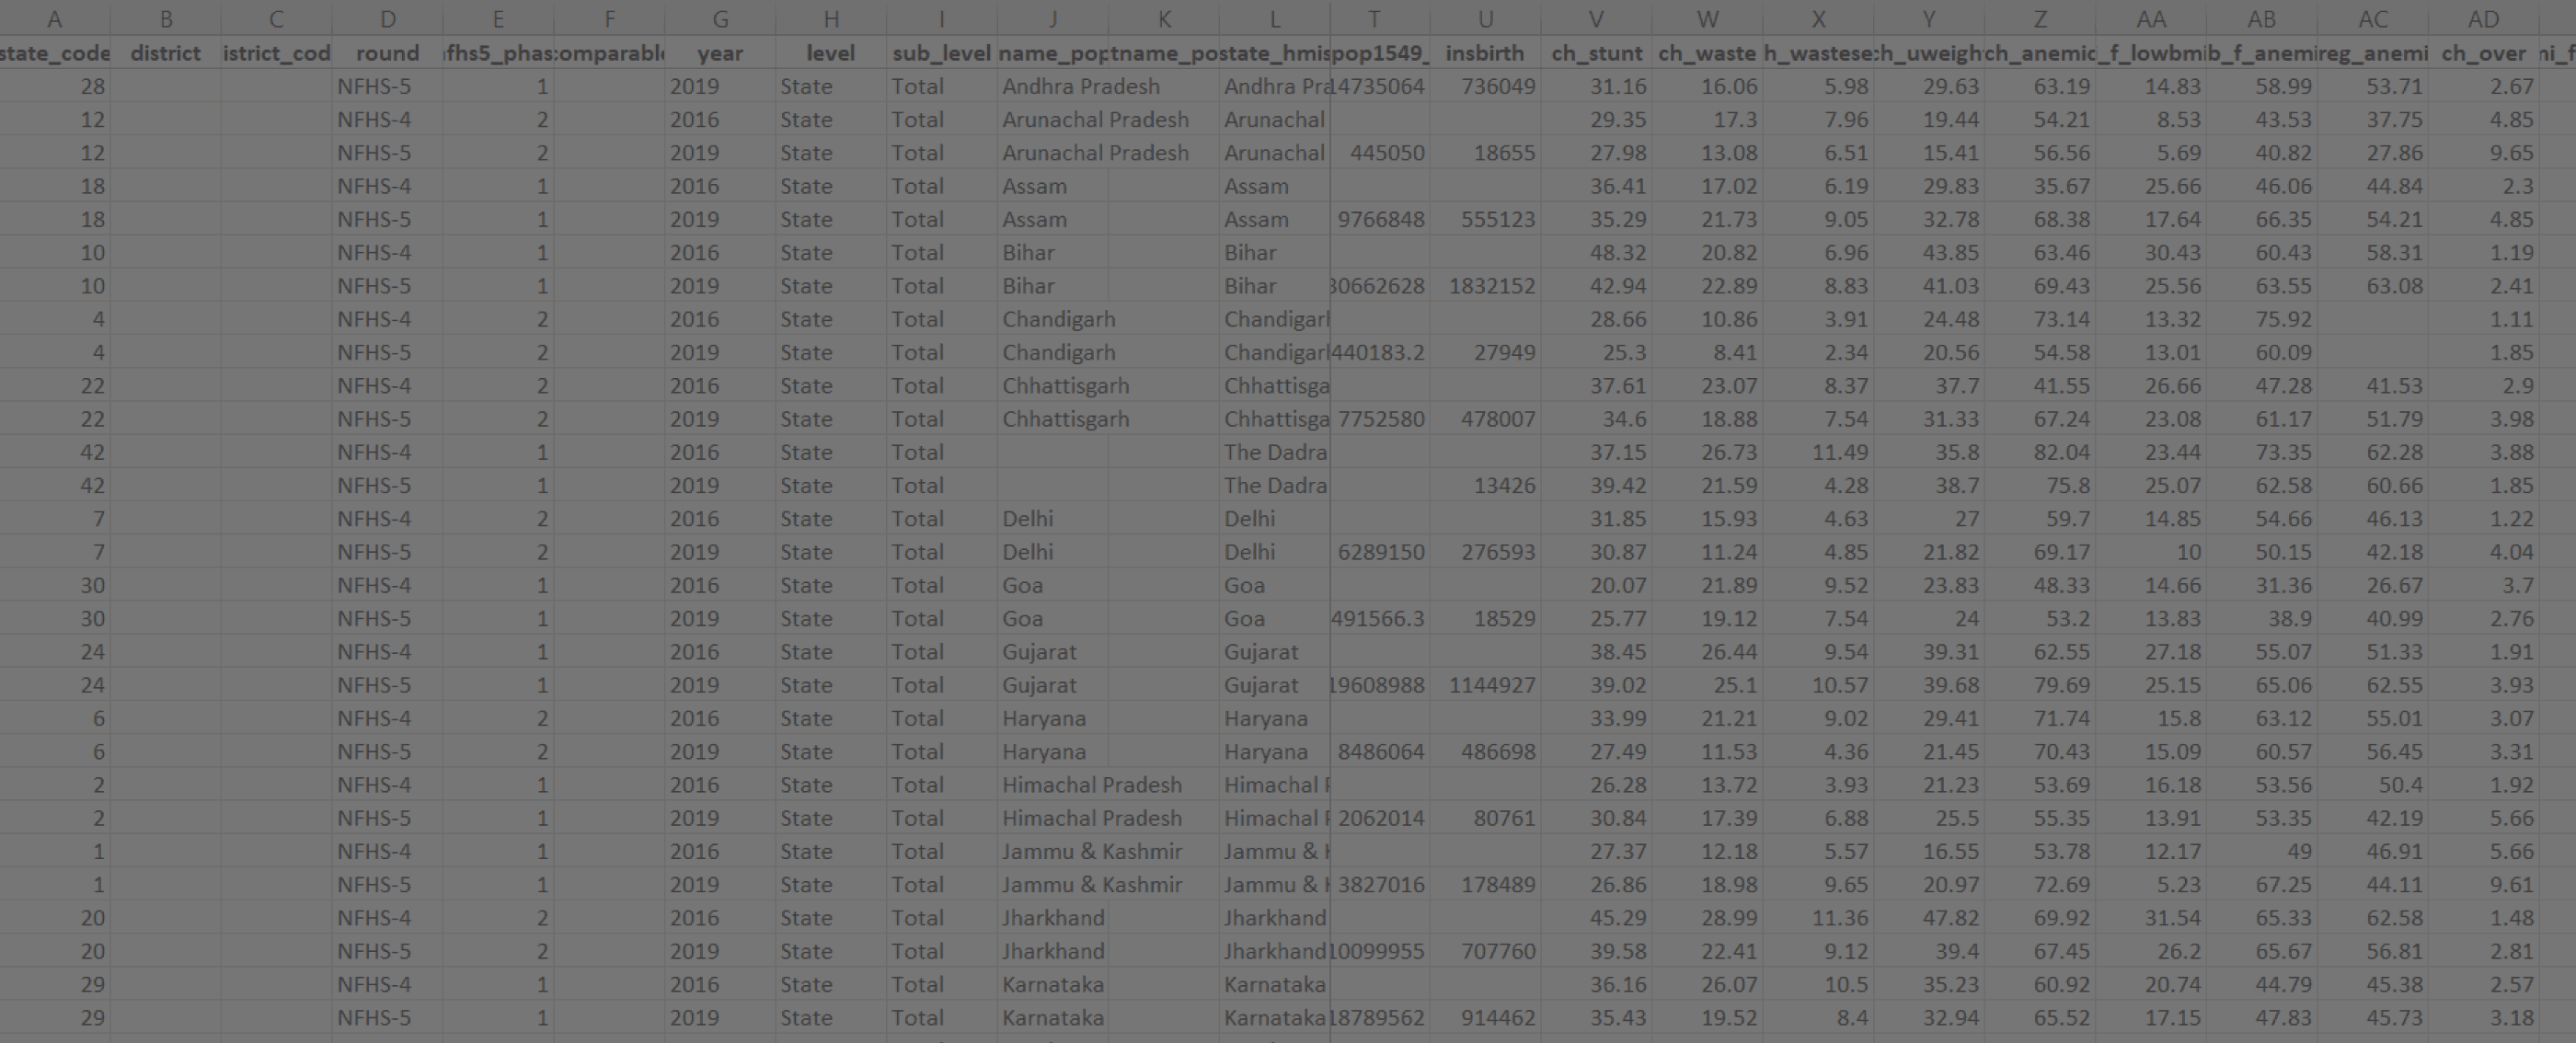
The National Family Health Survey (NFHS-4 2016, NFHS-5 2019)
The study aimed to visualize a large amount of data of NFHS 4 & NFHS 5 in India using data art or infographics.
02
DATA ANALYZING
After exploring the data, my focus shifted to identifying the core factors influencing stunted growth in India. I thoroughly analyzed the complete datasets of NFHS 4 and NFHS 5, meticulously selecting the key variables that contribute to stunted growth.
big data
But How?
small data
Which states in India show the highest levels of stunted growth among children?
Meghalaya
46.5%
Bihar
42.9%
Uttar Pradesh
39.7%
Jharkhand
39.5%
Gujarat
39.0%
Drinking water
Clean drinking water improves cognitive development, as dehydration can negatively affect brain function and impair cognitive abilities.
Immunization
Immunization can prevent infectious diseases that can cause stunted growth in children.
Breast feeding
Breastfeeding can help prevent stunted growth by providing infants with essential nutrients and antibodies that support healthy growth and development.
Adequate diet
Adequate diet provides essential nutrients that are necessary for proper growth and development, which can help prevent stunted growth.
Vitamin A
Vitamin A deficiency can lead to stunted growth by impairing bone development and reducing immune function.
Complementary food
Insufficient intake of complementary food, in terms of both quantity and frequency, can lead to malnutrition and stunted growth.
What are the primary factors that have contributed to the high stunted growth percentages in these states?
NFHS-4
Meghalaya
70
36
58
61
7
43
States
Breast feeding
Vitamin A
Immunization
Adequate Diet
Complementary food
Drinking water
NFHS-5
Meghalaya
79
43
61
64
9
53
NFHS-4
Bihar
98
53
63
61
7
31
NFHS-5
Bihar
99
59
56
71
11
39
NFHS-4
Uttar Pradesh
98
42
44
51
10
58
NFHS-5
Uttar Pradesh
99
60
74
70
9
51
NFHS-4
Jharkhand
78
65
57
62
23
50
NFHS-5
Jharkhand
87
76
71
74
14
42
NFHS-4
Gujrat
96
56
75
50
10
NA
NFHS-5
Gujrat
97
65
86
76
22
NA
The above data is in percentage
Sorted data 📊
What did we learn from this analysis?

Vitamin A
increased
Adequate diet
provided
Breast feeding
increased
Stunted growth
increased
Drinking water
improved
In 2019 according to NFHS 5 survey,
03
CONCEPTAULIZATION
Next, I had to determine the best way to present the sorted data cohesively within a single visual representation
Join me in tracing my thought path.

Data visualization
Infographic
Data art
OR
OR
💡
How?
Let’s try ABACUS!
But why?
-Abacus is generally used to brush up the intellect and cognitive skills of the children.
-The indirect relationship between the use of an abacus and stunted growth in children is that it can help to improve cognitive skills in children, leading to better overall health and development.
What’s the point?
-Children who have stronger cognitive skills are more likely to have better overall health and development, which can help to prevent stunted growth.
-Additionally, the use of an abacus can also help to improve a child's ability to focus and pay attention, which can also contribute to better overall health and development.
"Beneath its beads, the abacus nurtures a kaleidoscope of abilities"
Mental calculation skills
Visual-spatial skills
Concentration and focus
Multisensory learning
Circling back to the origin!
Let's rewind a bit and grasp the fundamentals of the abacus to comprehend the essence of the data art.
Okay wait! 🤓
Video credits- Aditya Tupe
Let's enjoy a little activity – even without a physical abacus! Give it a try by visualizing and counting your birth date on an imaginary abacus.
Got a knack of it?

Mine is 30th Oct 🫣
Hold & drag the beads
SVG
This is the TENS place
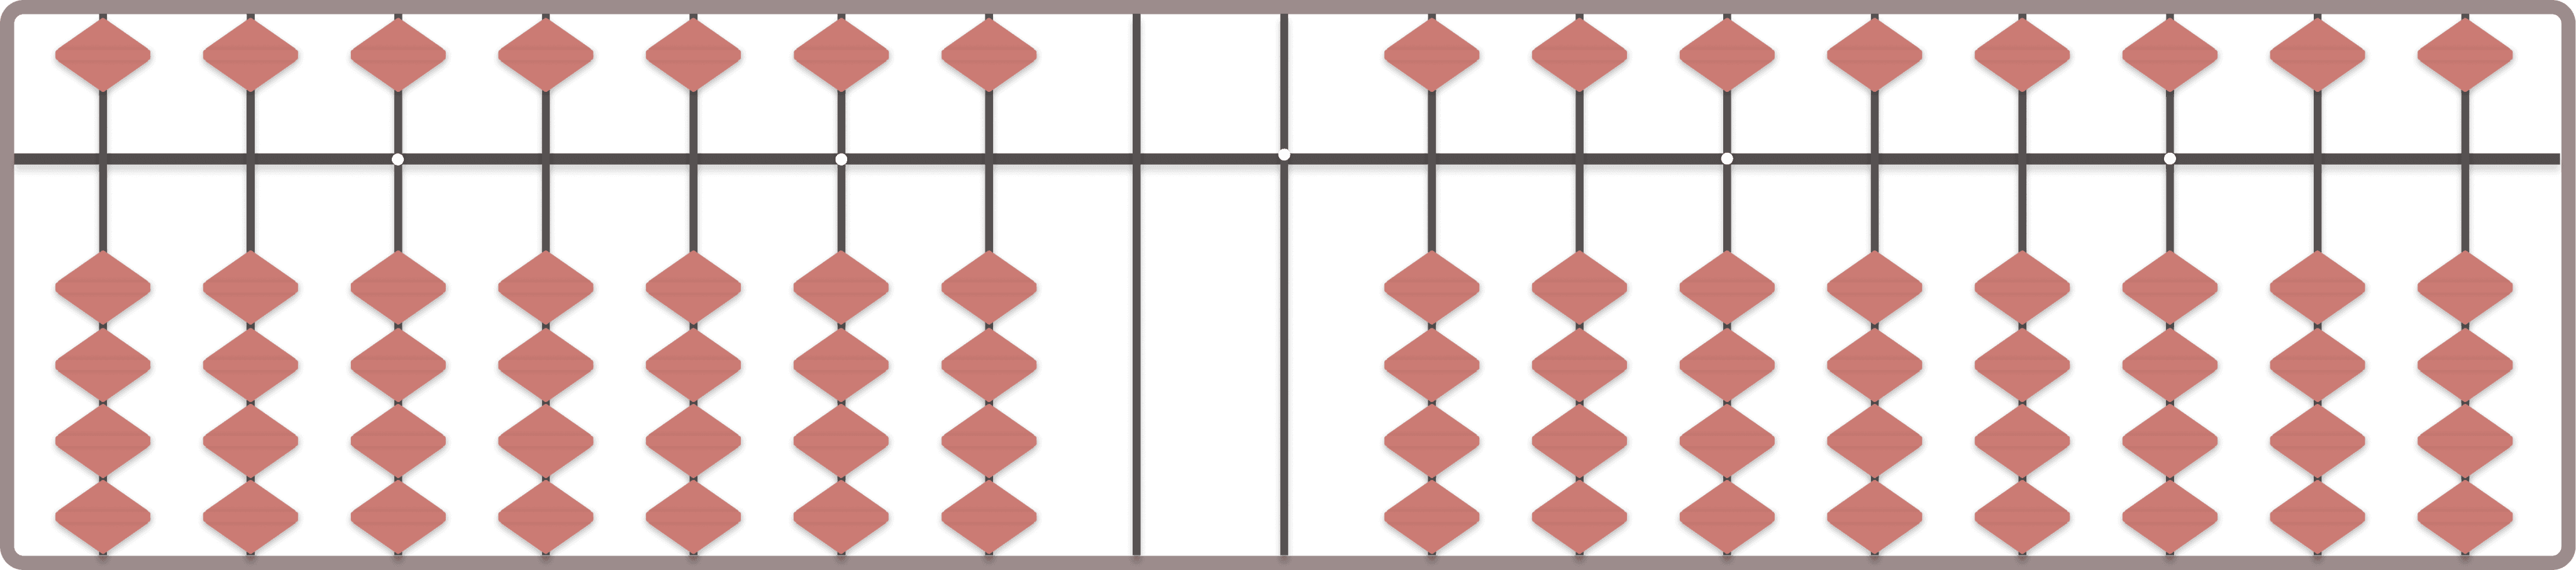

Count 1
This is the ONES place
Try counting you BIRTH DATE on the abacus! 😍
Birth Date
Try ABACUS yourself!
Well done! Now, we've got three essential things on hand.
Top 5 states data having the highest stunted growth in India
Factors that affected stunted growth
Abacus as our concept
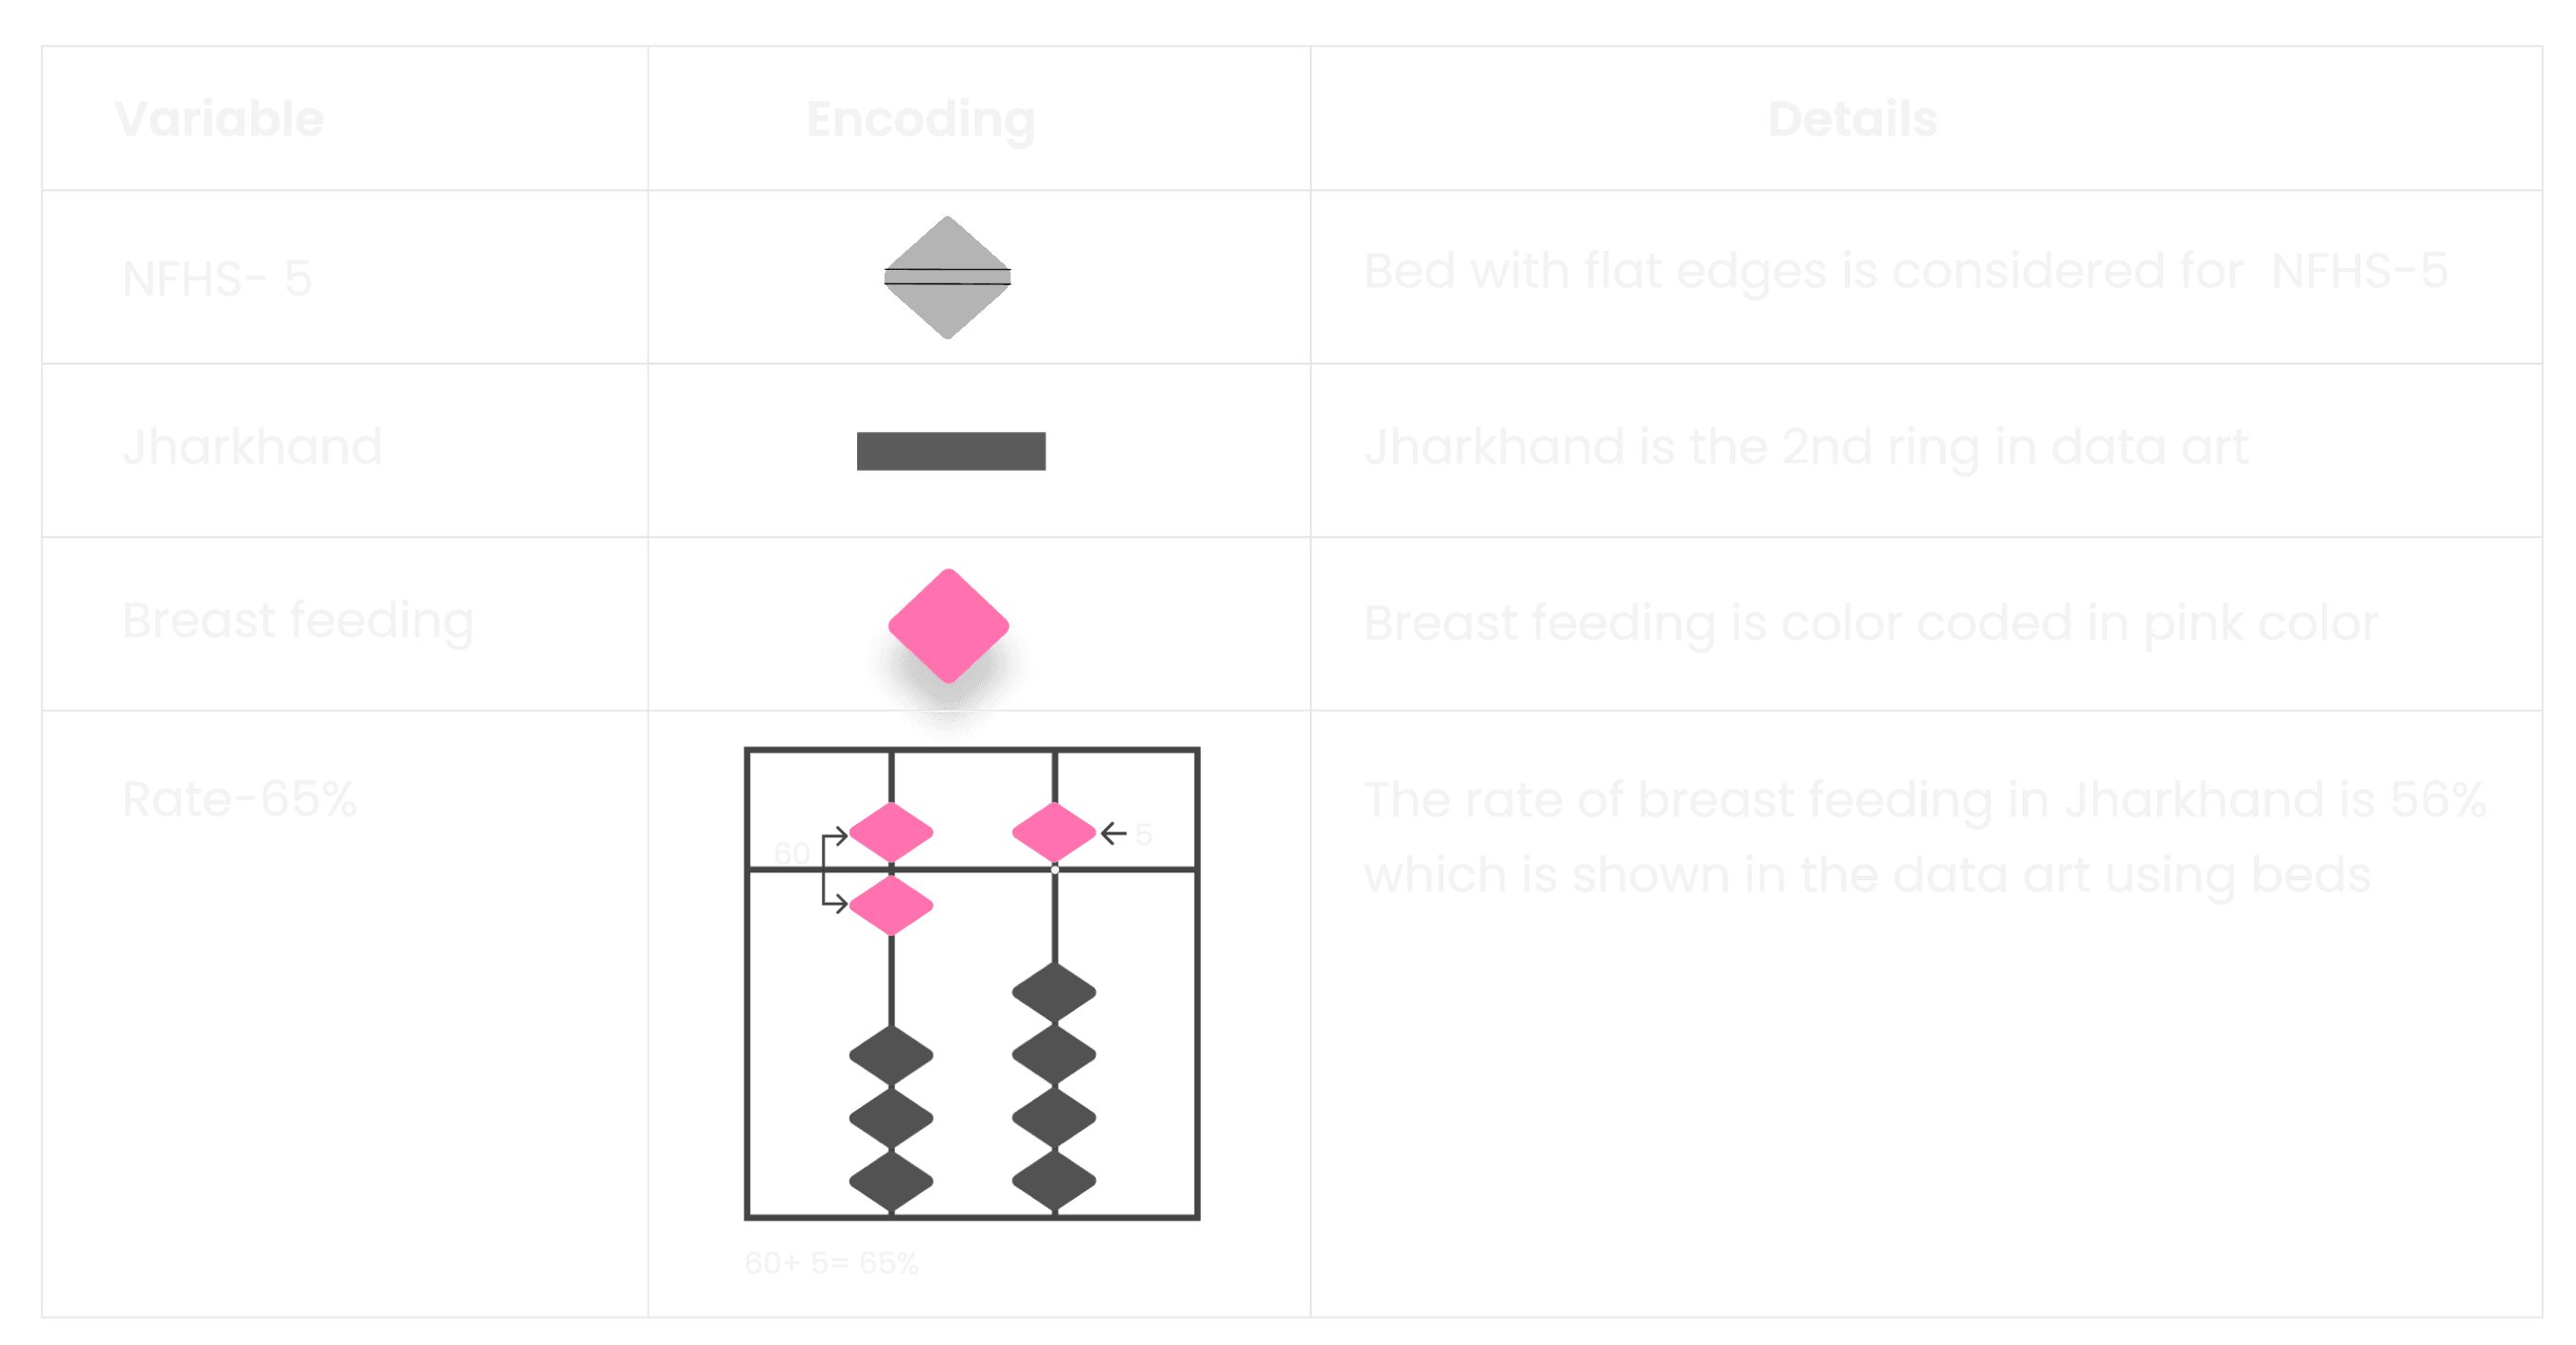
A. THICKNESS
To distinguish between states on the ring
C. COLOR
To indicate the various variables that affect stunted growth type
B. SHAPE
To show the arrangement of the abacus beads
Encoding the data
04
VISUALIZATION
Alright, let's determine the ways we can visually show the connection between stunted growth and its influencing factors in our data art.
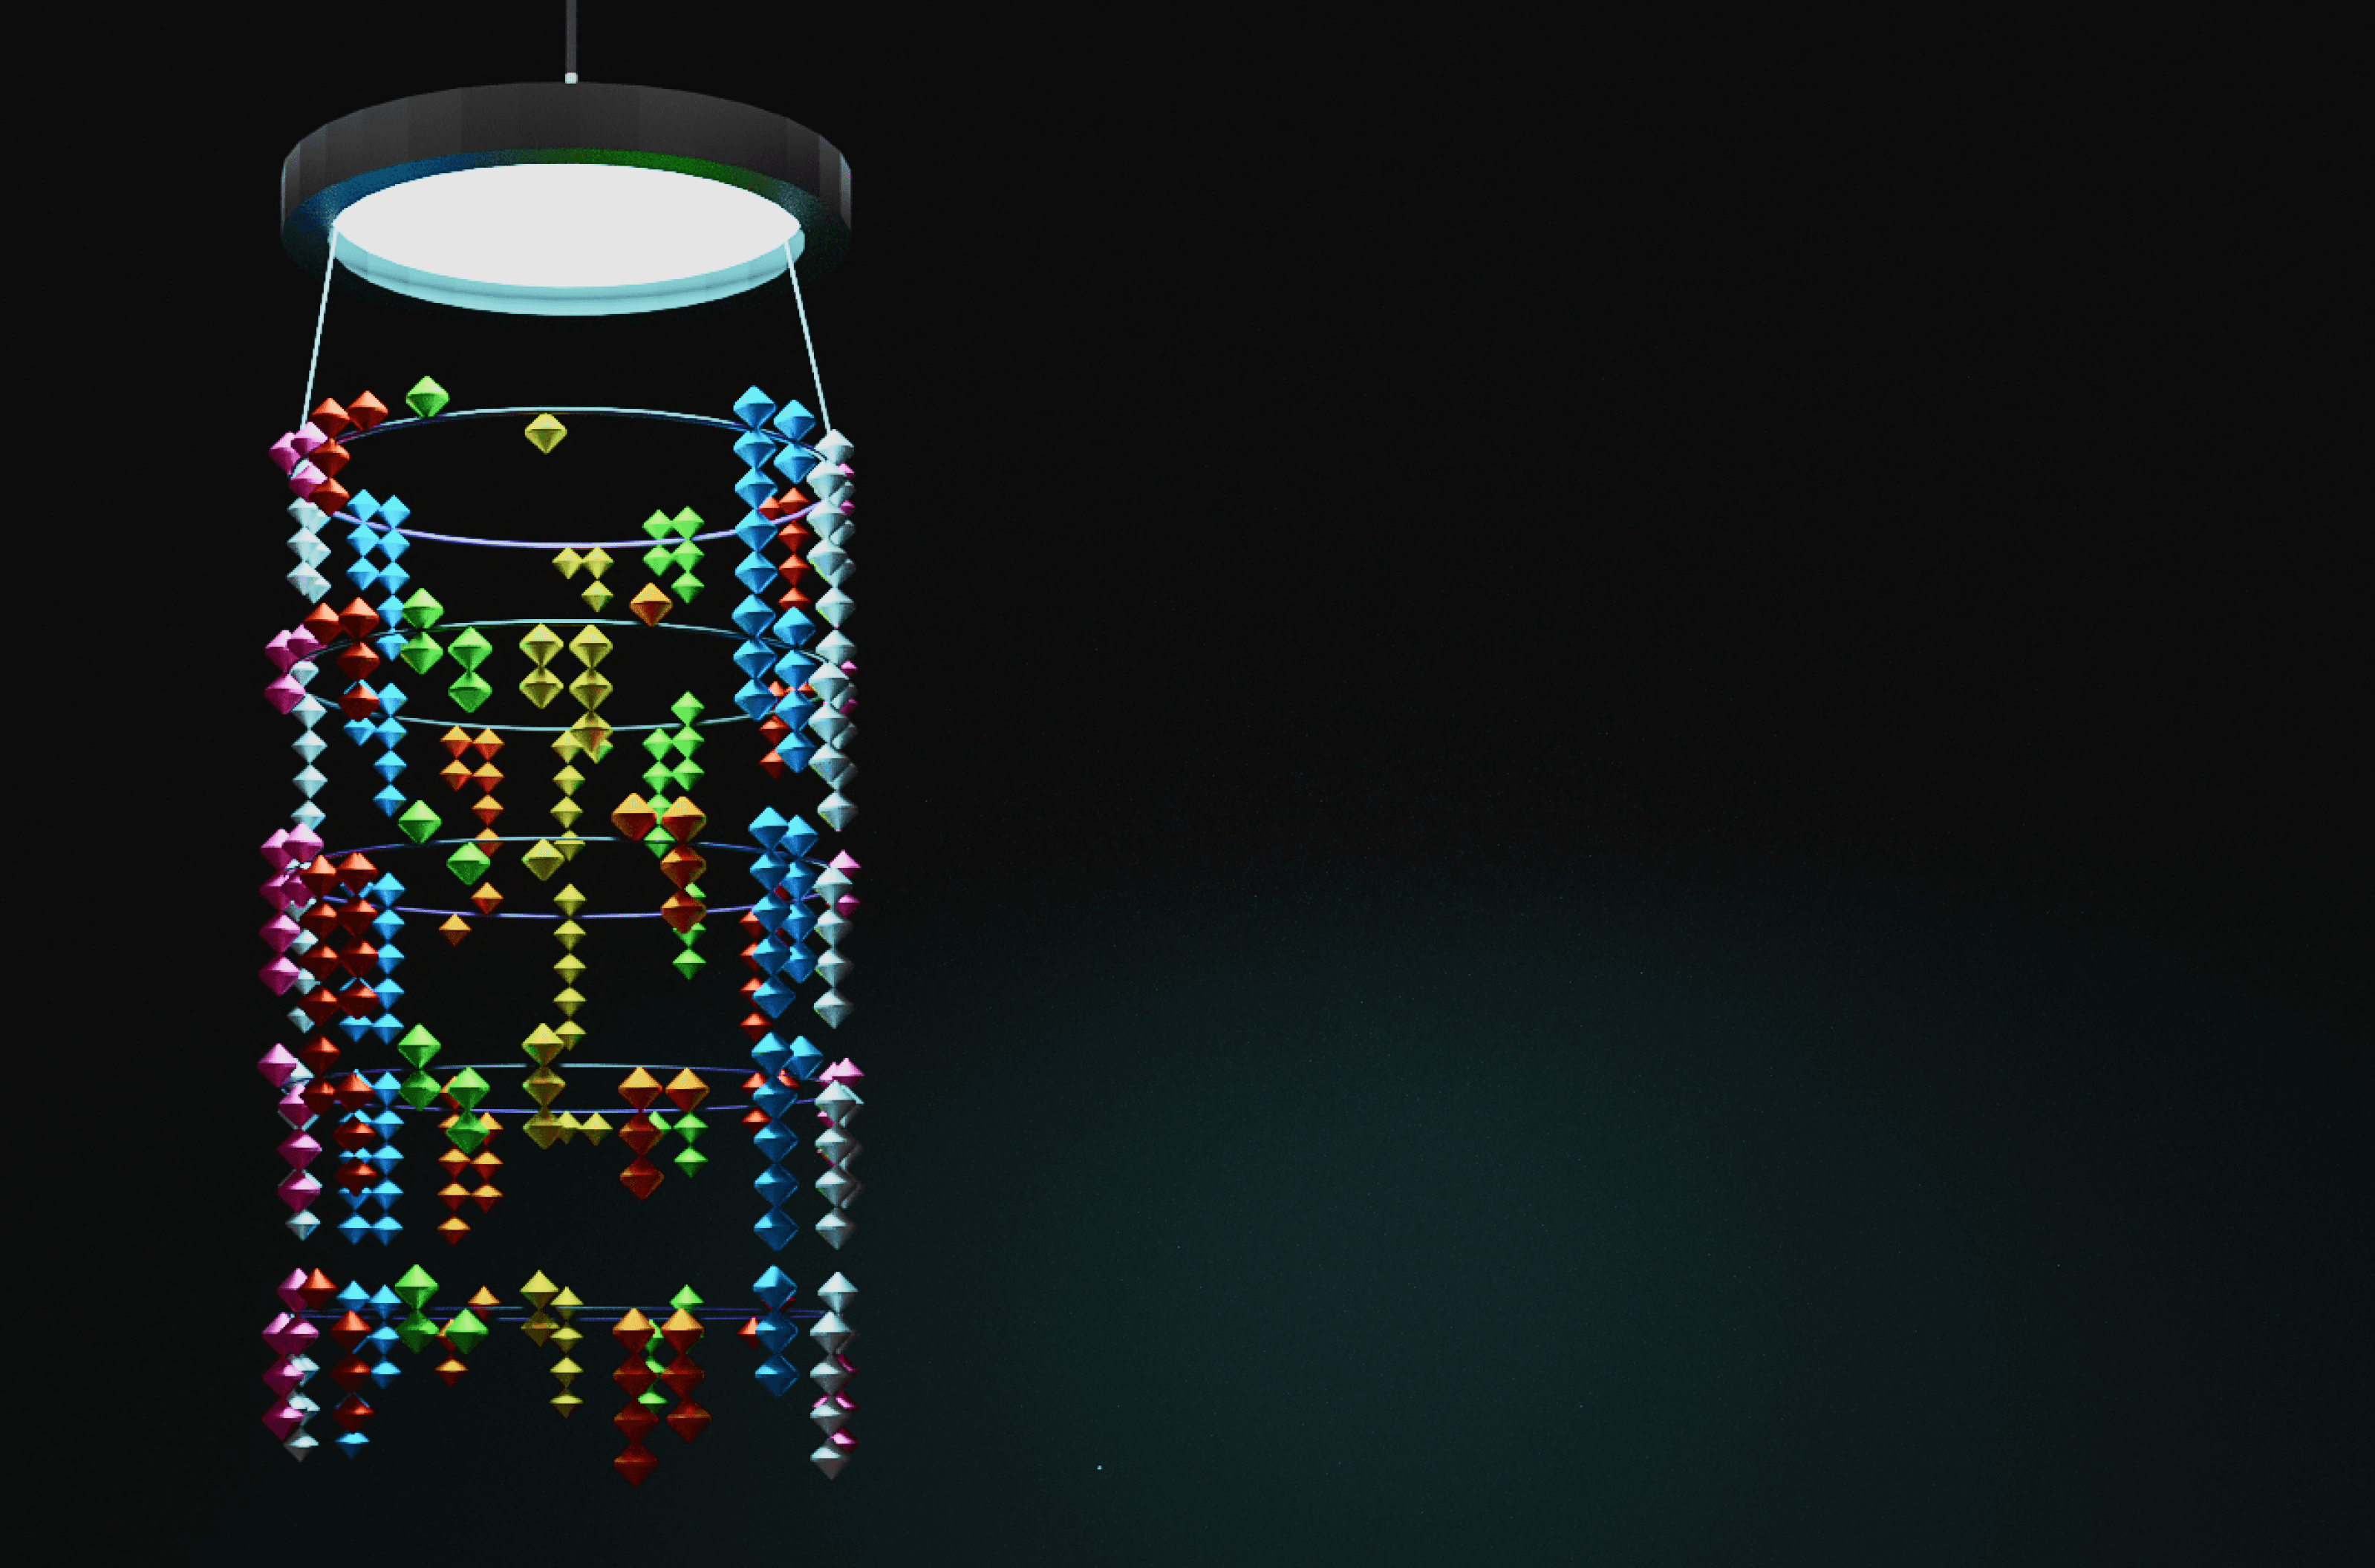
🧮

Gujrat
The data art displays rings for each state, arranged in ascending order based on the percentage of stunted growth observed in the NFHS 5 survey.
To distinguish between states on the ring thickness encoding is used
The states listed in the order from the least stunted to the most stunted growth are Gujarat, Jharkhand, Uttar Pradesh, Bihar, and Meghalaya.
Meghalaya is located at the bottom because it has the highest percentage of stunted growth observed in the survey because stunted growth refers to impaired physical development resulting in shorter height than expected for a particular age group.
Jharkhand
Uttar Pradesh
Bihar
Meghalaya
A. THICKNESS
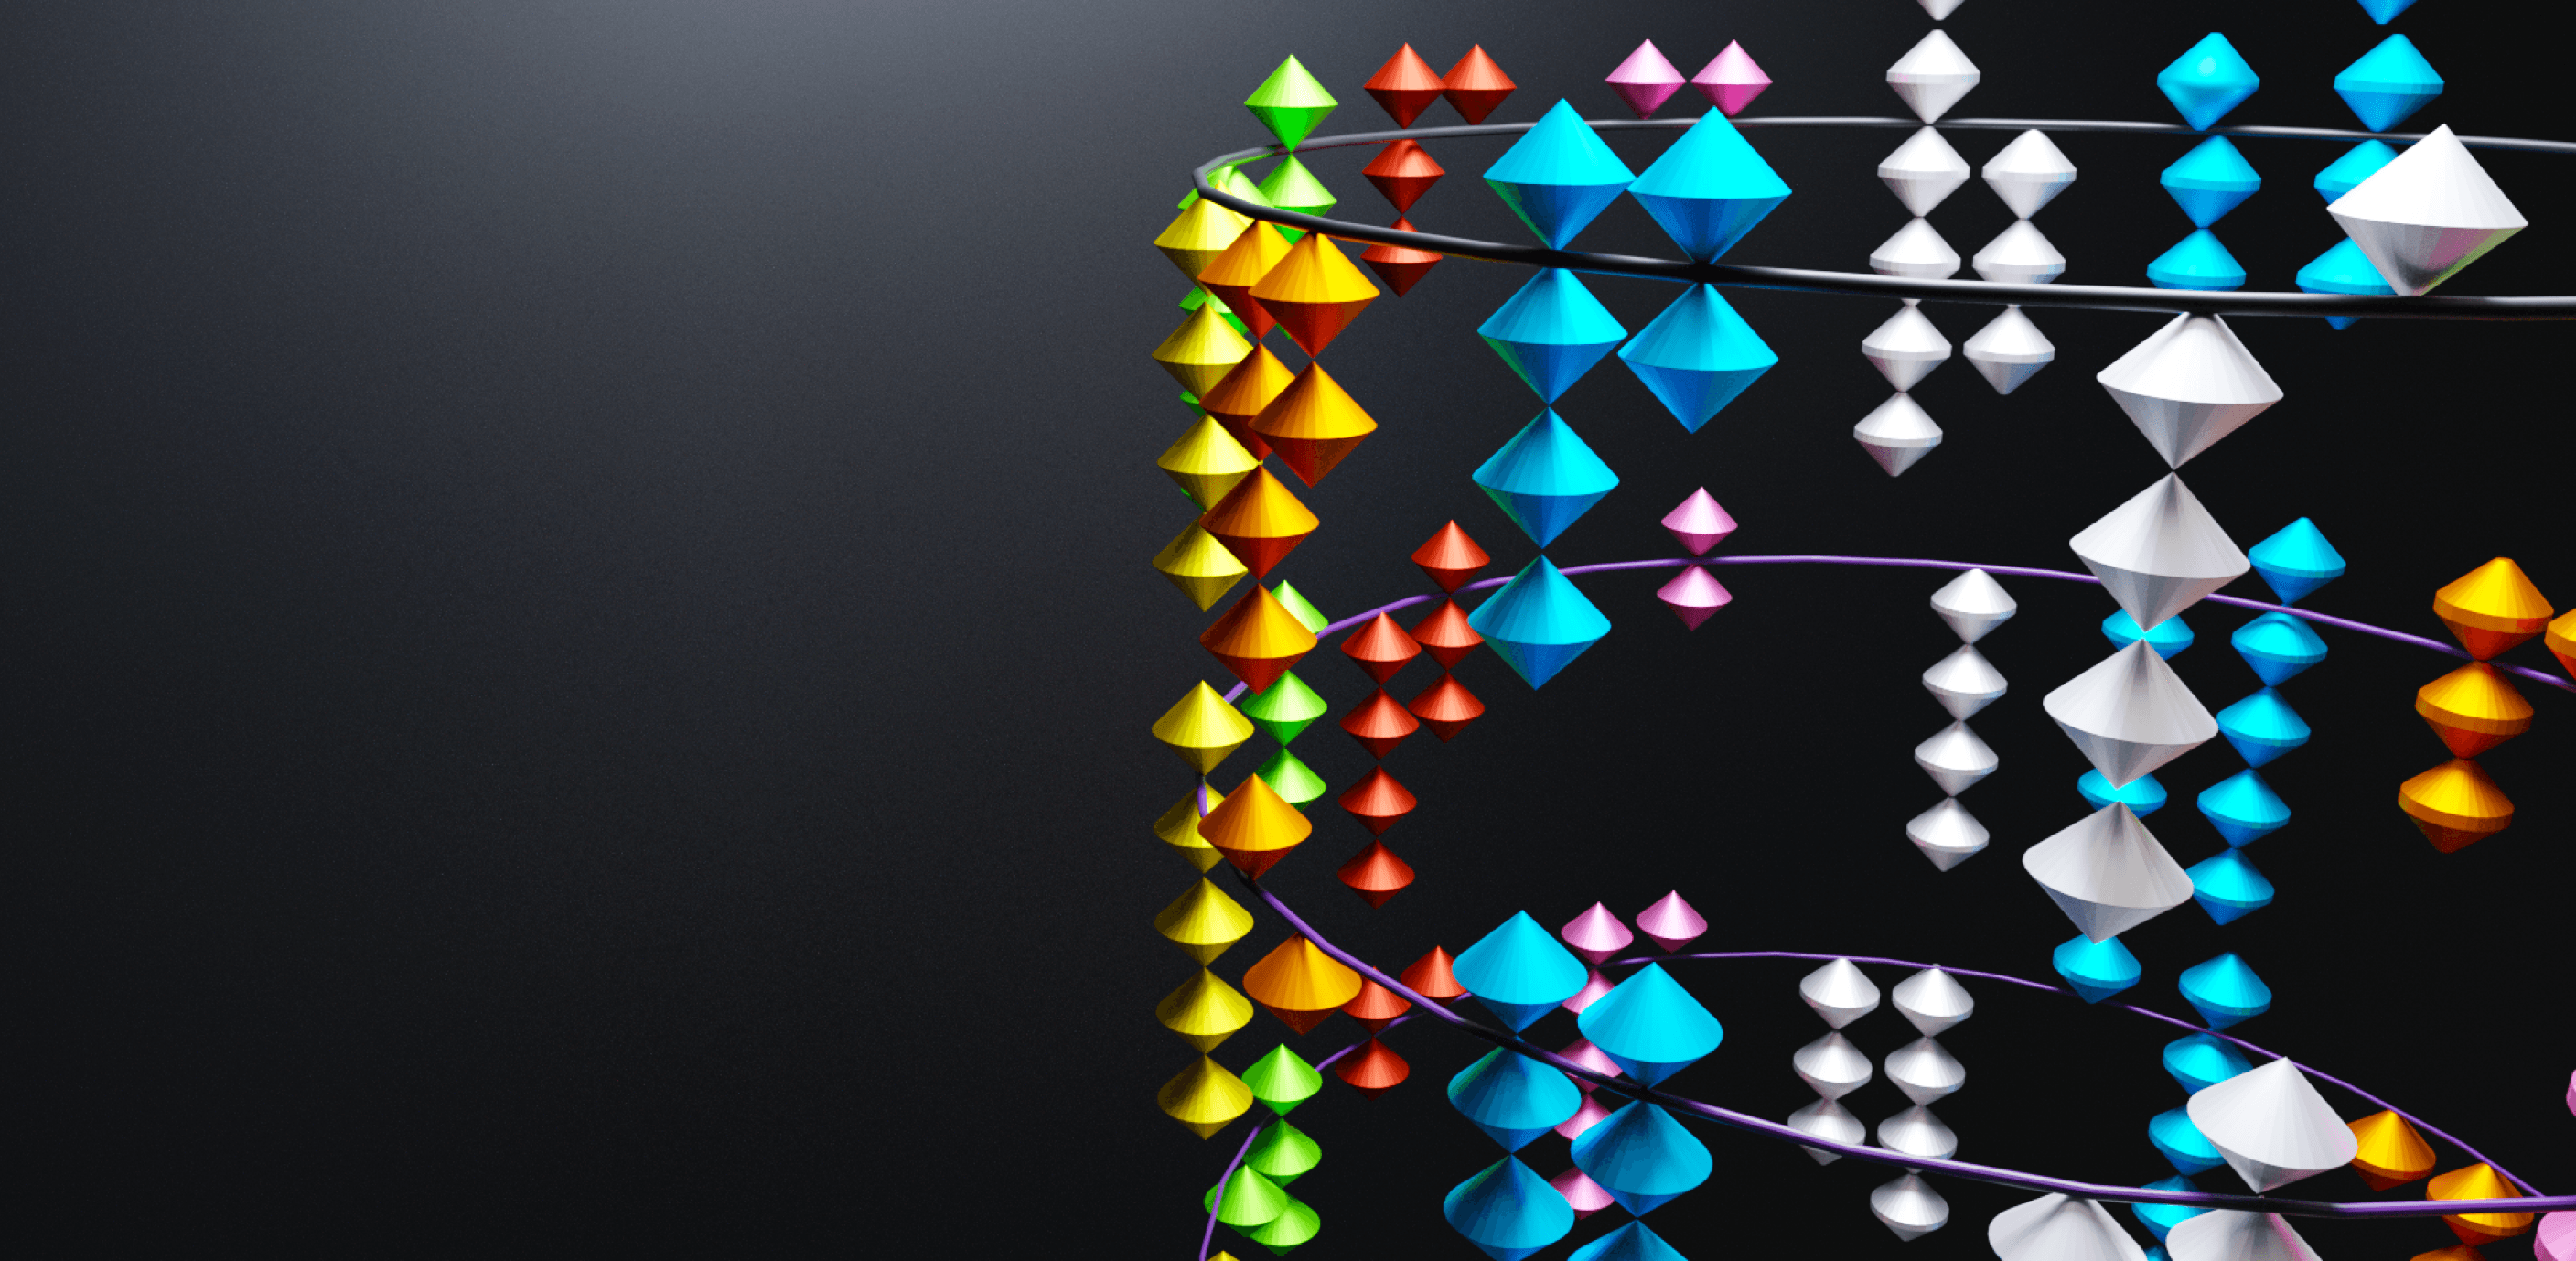
NFHS 4 is distinguished by keeping the beads pointed at the edges
A. SHAPE
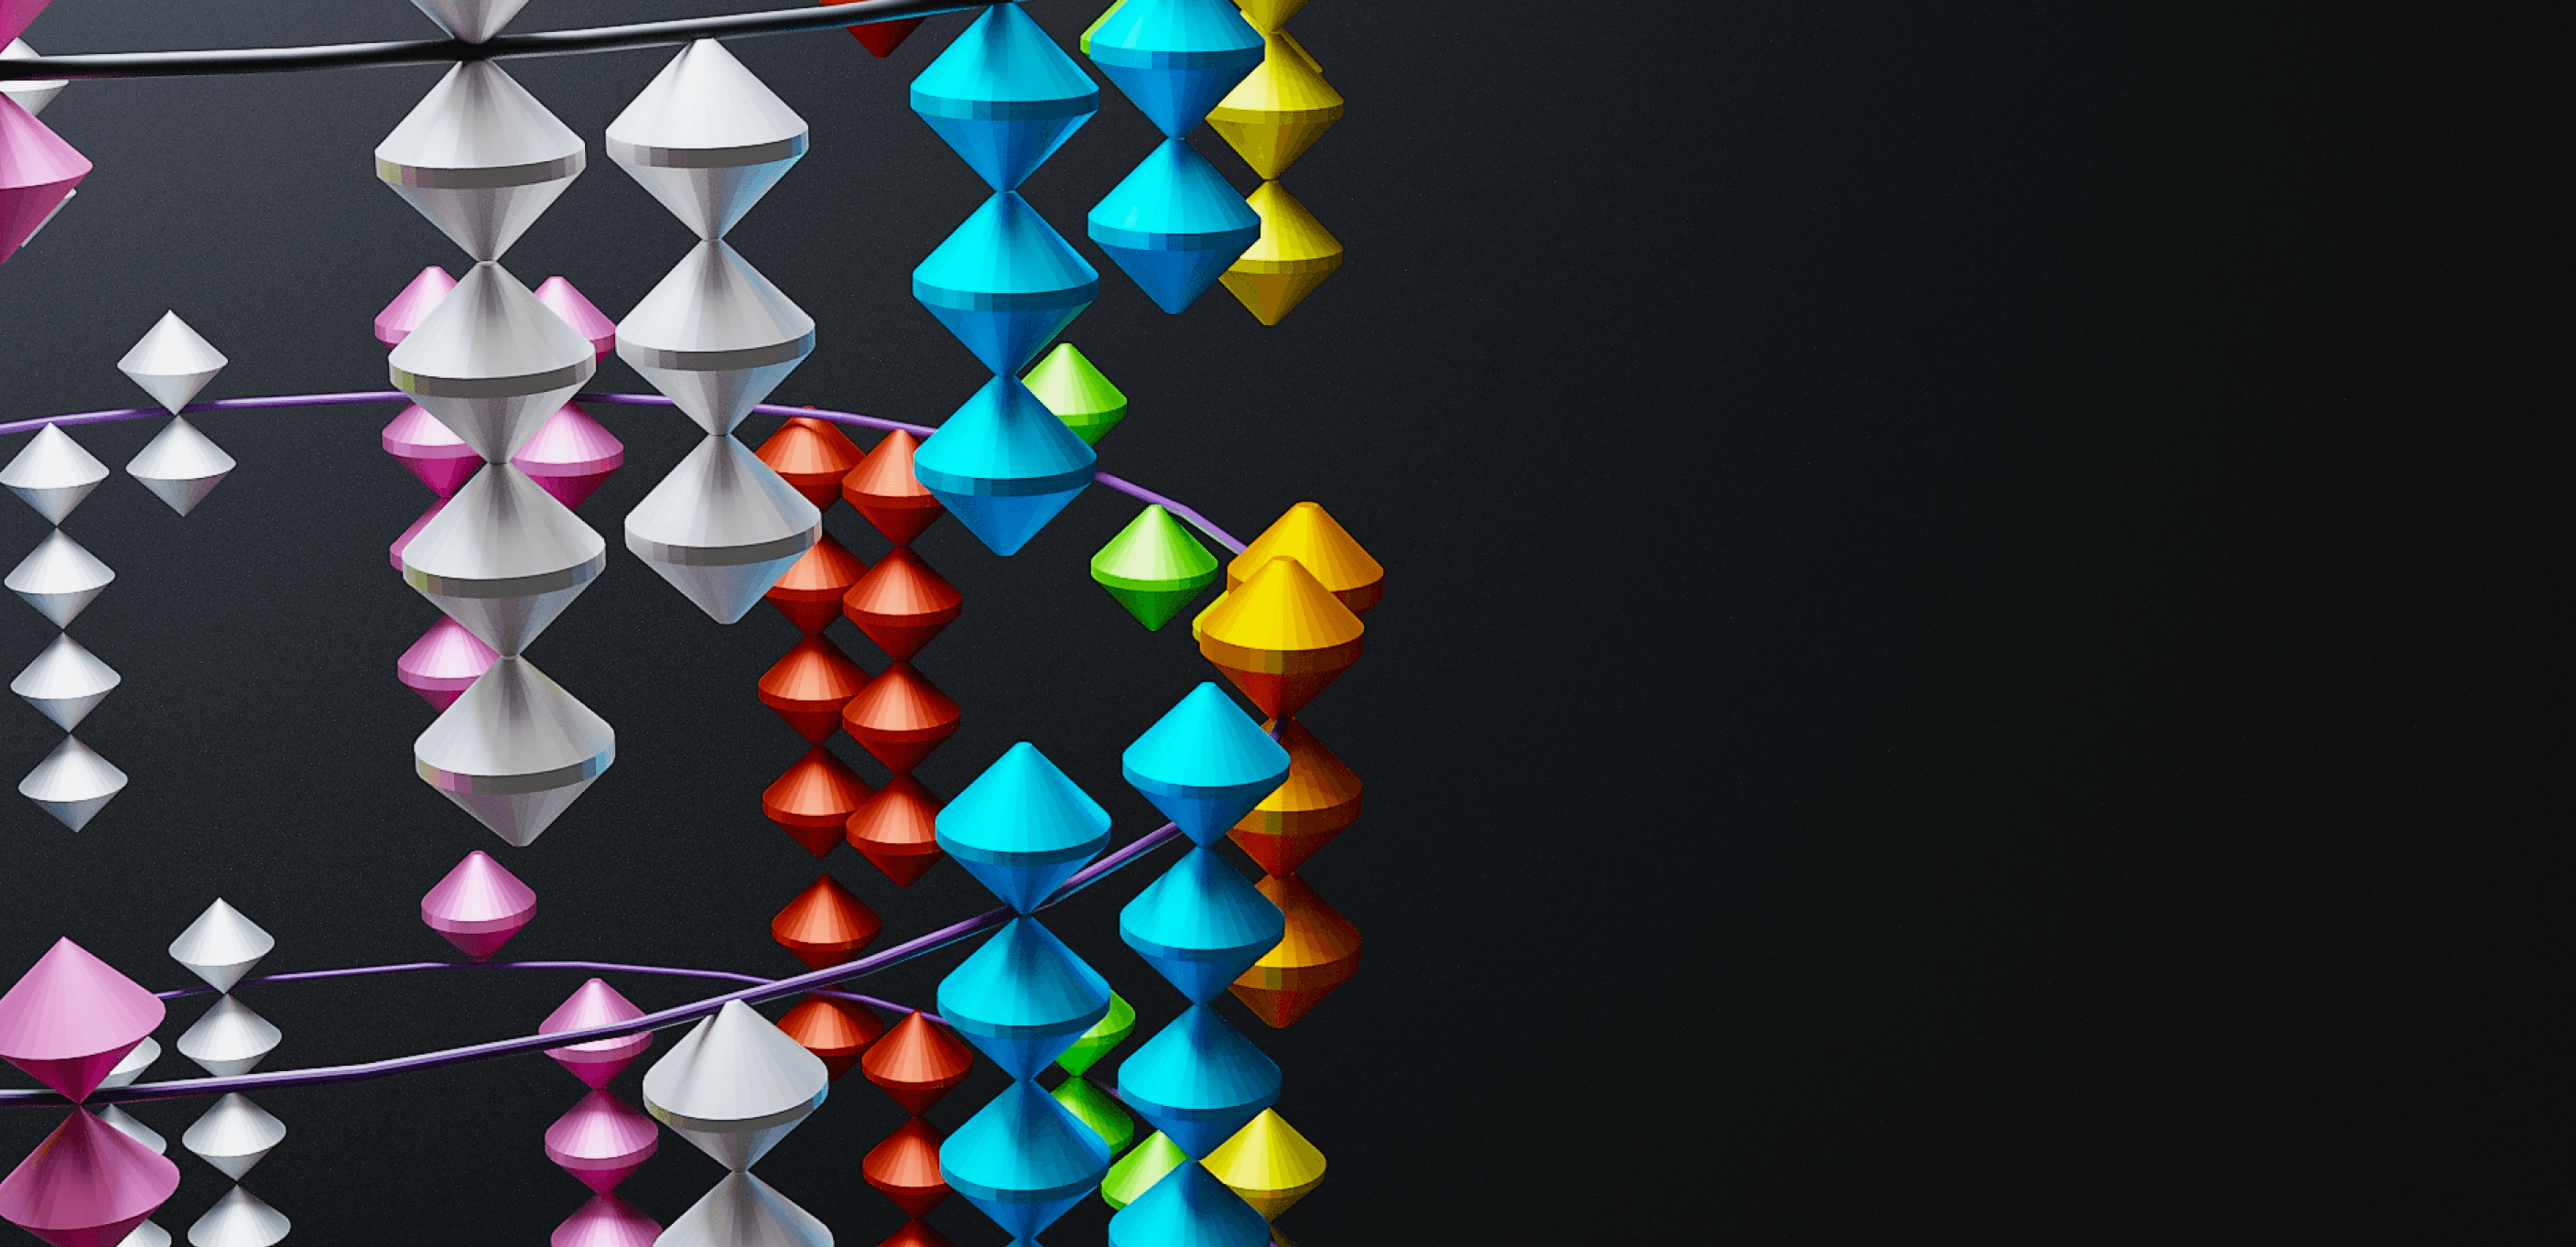
NFHS 5 is distinguished by adding a plane between the beads
A. COLOR
Factors that influence stunted growth type in children are color encoded as follows
Stunted growth
Breast feeding
Vitamin A
Immunization
Drinking water
Adequate food
Complementary food
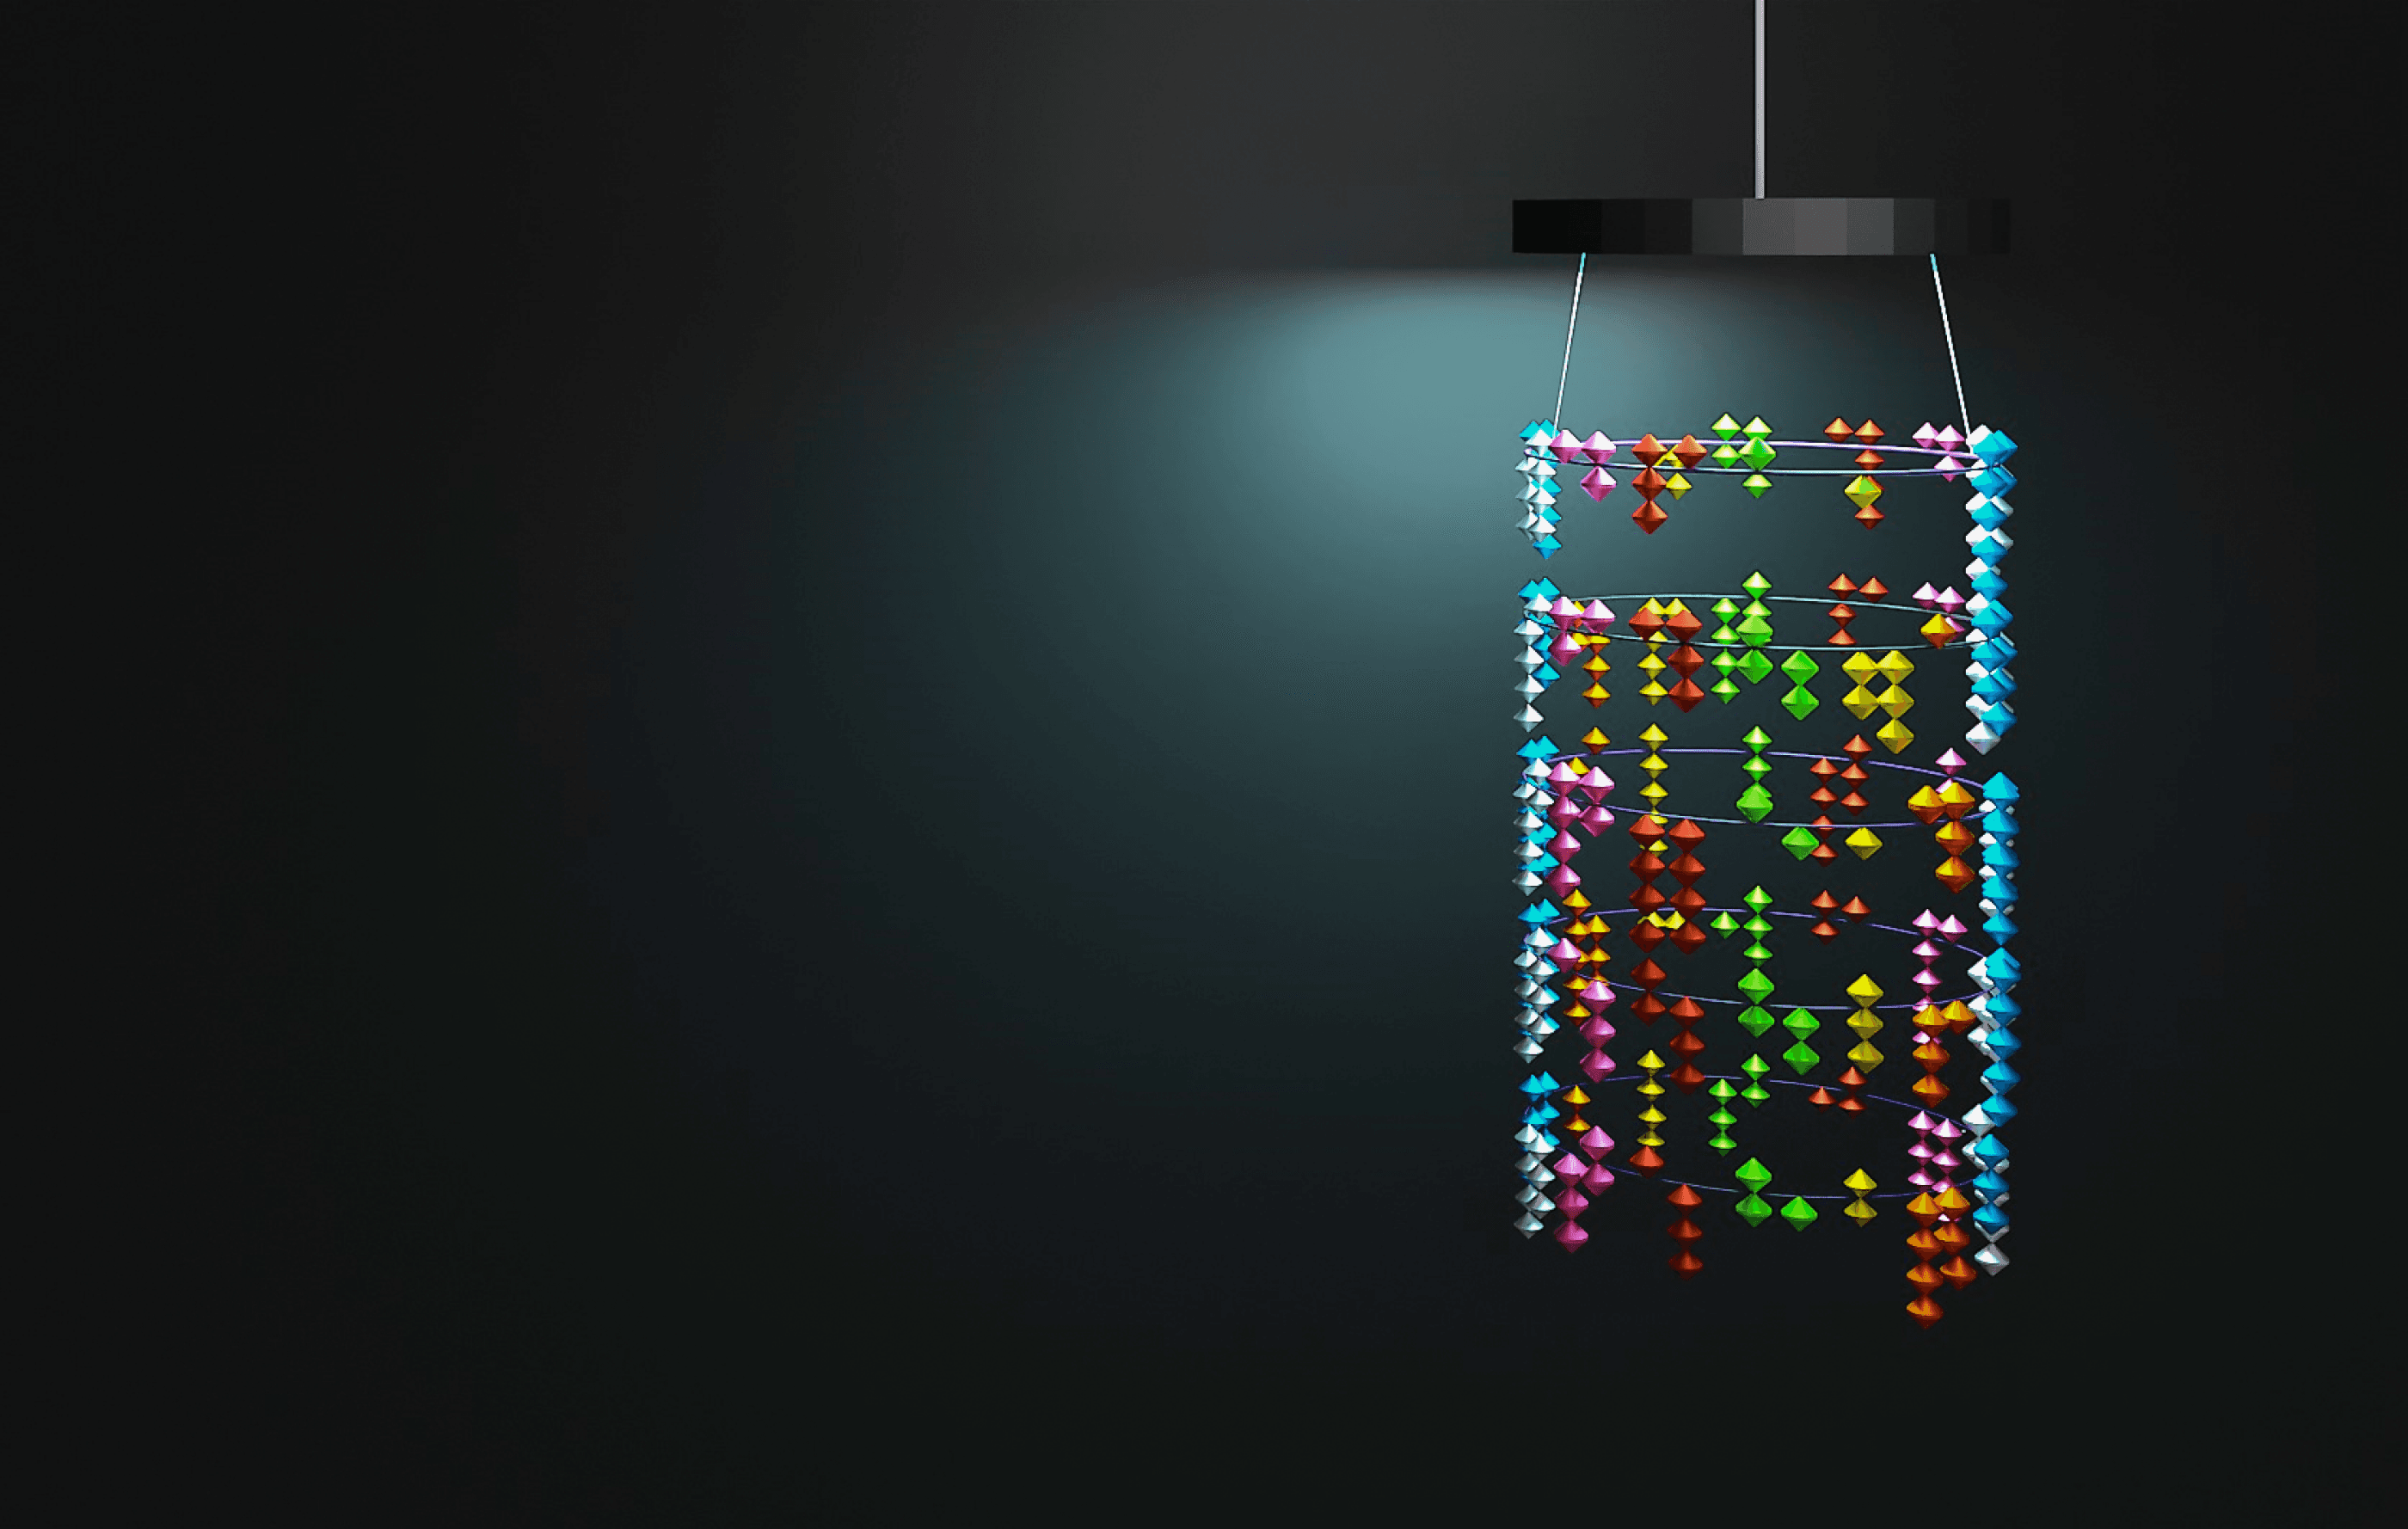

1 bed= 1 %
Here’s the answer,
ankgun
Lets try and visualize
How would you find the breast feeding rate in NFHS 5 in Jharkhand state ?
Indeed, we've successfully reached this point! Now, feel free to explore the data art on your own.
Legend
Stunted growth
Breast feeding
Vitamin A
Immunization
Drinking water
Adequate food
Complementary food
Basics of abacus
Units
Units
Ideal state
Units
Units
Tens
Tens
Tens
Tens
1
2
3
4
5
10
50
20
30
40
5
50
4
40
9
90
+
+
=
=
NFHS 4
NFHS 5
Why ankgun?
Ankgun is derived by combining the words 'number' and 'quality. It suggests that numbers and quality are intertwined and equally important when it comes to understanding the factors that contribute to a child's development.
ankgun
Font
Samarkan

-Explored the power of 3D elements in enhancing data visualization interactively.
-Gained understanding in data cleaning and sorting procedures.
-Developed skills in filtering and extracting relevant information, culminating in refined statistics.
-Developed the ability to translate data insights into visually appealing representations
-Expanded my knowledge on incorporating various concepts for data visualization.
-Gained insight into different data encoding techniques for visualization purposes.
Things I learnt
-Attained a comprehensive perspective through 3D elements
-Offering a 360-degree visualization experience.
-Conducted data cleaning and sorting, eliminating extraneous information
-Generated final statistics for selected variables and states.
-Translated data insights into a captivating 3D artwork using Blender.
-Identified and analyzed extensive datasets to effectively organize them.
What did we achieve from this project?
Previous